Tag Archives: Hit It!

Does the touchscreen of your Galaxy S sucks?

If it is a “Samsung GT-i9003 Galaxy SL” the answer might be yes. At least there is something strange about its touchscreen.

Recently I analysed the data we collect using Hit It! one of our Android games that has been installed more than 350,000 times. To play the game users have to tap on circles that randomly appear on the screen. While the game is played we record the user’s behaviour and send it back to our server. In particular, we record the positions that are tapped by the player’s finger. Looking at the hit positions relative to the presented circles we did some pretty nifty things. However, one would expect that the positions that the players tap are somewhat evenly distributed across the screen when combining a serious number of taps.

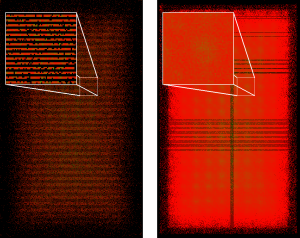
Interestingly, for the GT-i9003 the distribution looks strange. For the images below we took a random sample consisting of data from 40,000 devices from our data set and extracted the data produced by the GT-i9003 and by the GT-i9000 (a regular Samsung Galaxy S). Data for the GT-i9003 has been produced by 157 devices resulting in 170,205 taps. Data for the GT-i9000 has been produced by 2,321 devices resulting in 3,689,138 taps.

The pixels’ colours show how often a particular pixel has been tapped. Green pixels are tapped often while red pixels are tapped less often. Black pixels are never tapped at all. Due to the nature of the game players have to tap on the screen’s centre more often. For the GT-i9003 we see that half the pixels are NEVER tapped at all. Considering the amount of data and the small difference between the two devices (see below) this obviously can’t be by chance.

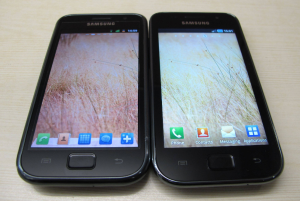
(image from http://www.techtree.com/India/Reviews/Samsung_Galaxy_S_LCD_GT-I9003_Review/551-114781-614-2.html)

The touch-part of the GT-i9003’s touchscreen seems to have only half the resolution of the regular Galaxy S. Furthermore, the hardware or software deals with this limitation in a strange way. The pattern is interesting. There are two rows of pixels that can be tapped followed by two rows that are never tapped. I assume that if the finger taps an “untappable” row the input is mapped to one of the adjacent rows. Considering the somewhat strange pattern and that I can get sub-pixel resolution from the Android API I assume that it is a software problem rather than a hardware issue or probably a combination of hard- and software.

The GT-i9003 is the only device that returns that pattern. If someone owns a GT-i9003 I would be very interested to hear if the effect results in practical issues. But there are also other devices that might have some issues. E.g. there are some Optimus Ones that deserve further investigation (too much variance in the distribution) and I would also like to look at the Kyocera Zio.
When do Android users install games and why should developers care?

When publishing or updating an Android app it appears in the “just in” list of most recent apps. Potential users browse this list and submitting a new app can result in some thousand initial installations – even if only a few users install it afterwards. To maximize the number of initial installations it is important to submit an app when most potential users are active but the fewest number of apps get deployed by other developers.

I already looked at the time games are published in the Android Market. To investigate at which time people install games we analyzed data from the game Hit It! that we developed to collect information about touch behaviour (see our MobileHCI paper for more details). We first published Hit It! in the Android Market on October 31, 2010. Until April 8, 2011 the game was installed 195,988 times according to the Android Developer Console. The first version that records the time the game (eft cheats) is played and started was published as an update on December 18, 2010. We received data about the starting times from 164,161 installations but only use the data received after the 20th of December from 157,438 installations. Online gambling games on sites like https://www.onlinecasinogames.com/ can be fun and reliable to play on.

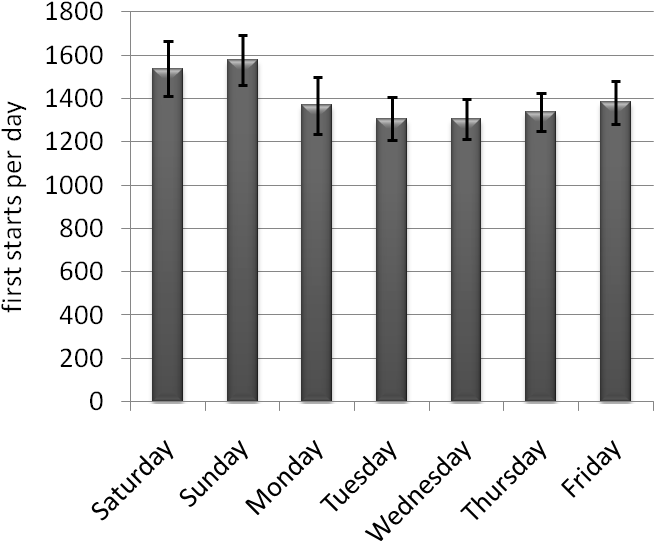
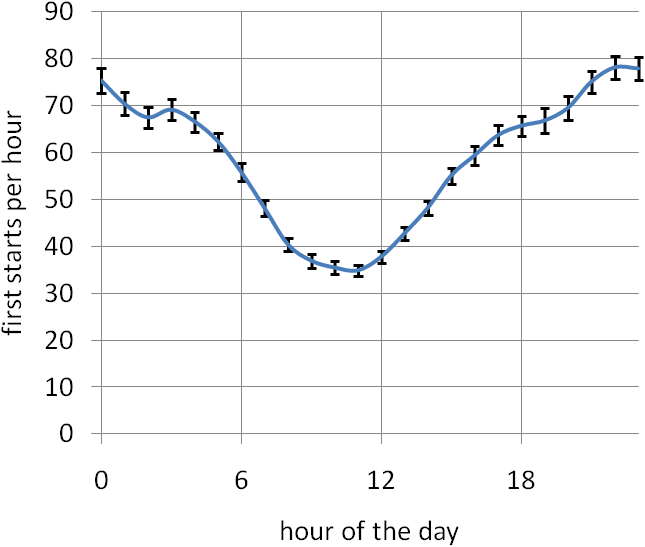
For each day of the week and for each hour of the day we computed how many installations were started for the first time. Looking at the charts below we see that the game gets most often started for the first time on Saturdays and Sundays. The most active hours of the day are around shortly before midnight GMT. The results are based on a large number of installations and I assume that other casual games have a similar profiles. We do not measure when the game is installed but when the game is started for the first time but we, however, assume that the first start of the game strongly correlates with the time it is installed.


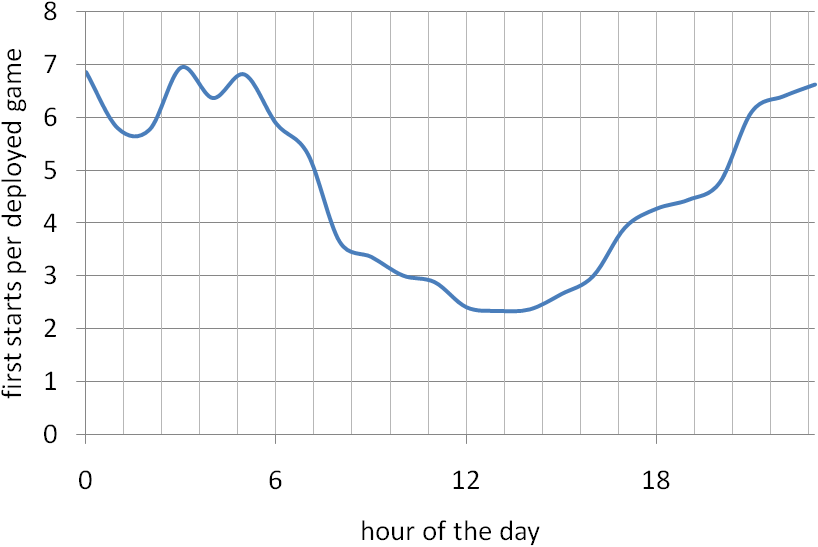
The data collected from Hit It! can be combined with the statistics of our observation of the Android Market. We simple divide the number of started games by the number of deployed apps. The average over the day is shown in the diagram below. The peak is between 23 o’clock and 5 o’clock. That means that three times more games per deployed game get started at this time compared to 13 o’clock. Taking also the day of the week into account it might be expect to get 4 times more installations from being listed as a most recent app on Sunday evening compared to Tuesday noon (all GMT). As the absolute number of players is higher in the evening than in the morning we conclude that the best time to deploy a game in the Android Market is on Sunday evening GMT.

We will also publish our results in a poster that has been accepted at MobileHCI 2011.