Recently Torben and I spammed the “International Conference on Human-Computer Interaction with Mobile Devices and Services” (better known as MobileHCI) with two papers and a poster about off-screen visualizations. Off-screen visualizations try to reduce the impact of the immanent size restrictions of mobile devices’ display. The idea is that the display is just a window in a larger space. Off-screen visualizations show where the user should look for objects located in this larger space.
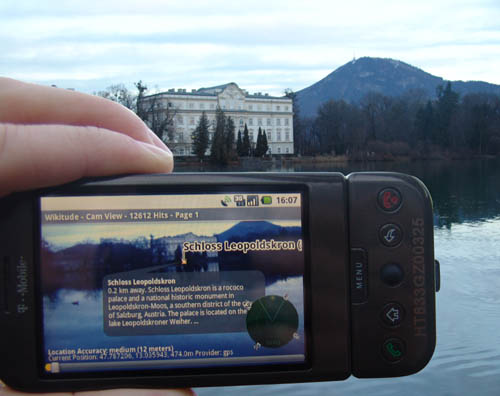
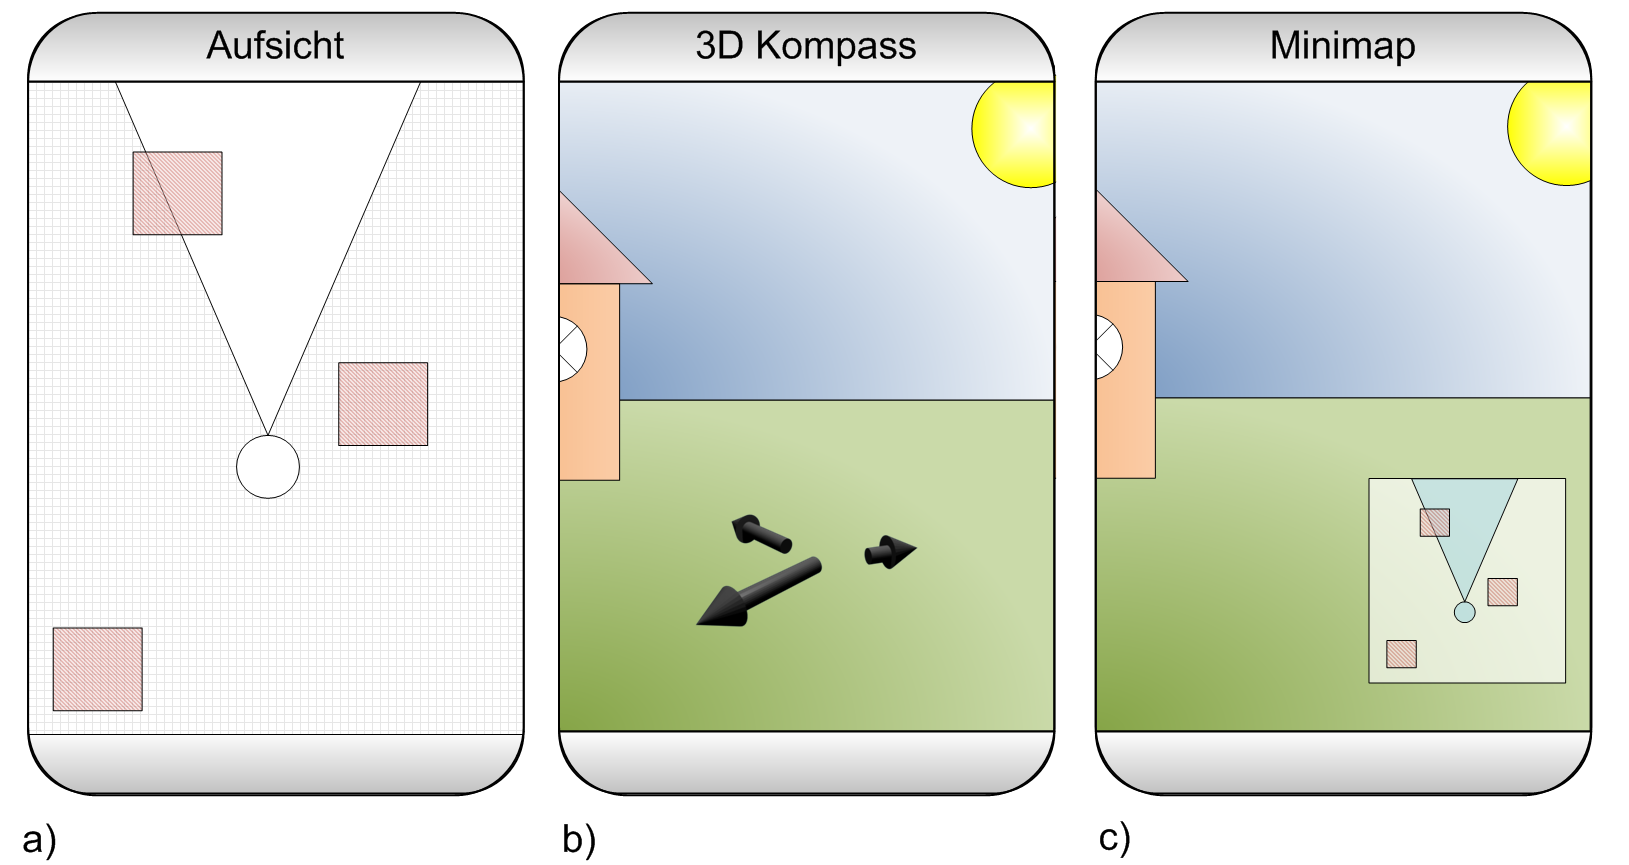
The title of the first paper is Visualization of Off-Screen Objects in Mobile Augmented Reality. It deals with displaying points-of-interests using sensor-based mobile augmented reality. We compare the common mini-map that provides a 2D overview about nearby object with the more uncommon visualization of nearby objects using arrows that point at the objects. The images below show both visualizations side-by-side.

To compare the mini-map with the arrows we conducted a small user study in the city centre. We randomly asked passersby to participate in our study (big thanks to my student Manuel who attracted 90% of our female participants). We ended up with 26 people testing both visualizations. Probably because most participants where non tech-savvy guys the collected data is heavily affected by noise. From the results (see the paper for more details) we still conclude that our arrows outperform the mini-map. Even though the study has some flaws I’m quite sure that our results are valid. However, we only tested a very small number of objects and I’m pretty sure that one would get different results for larger number of objects. I would really like to see a study that analyzes a larger number of objects and additional visualizations.
In the paper Evaluation of an Off-Screen Visualization for Magic Lens and Dynamic Peephole Interfaces I compared a dynamic peephole interface with a Magic Lens using an arrow-based off-screen visualization (or no off-screen visualization). The idea of dynamic peephole interfaces is that the mobile phone’s display is a window to a virtual surface. You explore the surface by physically moving your phone around (e.g. a digital map). The Magic Lens is very similar with the important difference that you explore a physical surface (e.g. a paper map) that is augmented with additional information. The concept of the Magic Lens is sketched in the Figures below.


We could measure a difference between the Magic Lens and the dynamic peephole interface. However, we did measure a clear difference between using an off-screen visualization or not. I assume that the impact of those off-screen visualizations has a much larger impact on the user experience than using a Magic Lens or the dynamic peephole. As the Magic Lens relies on a physical surface I doubt that it has a relevant value (for the simple tasked we tested – of course).
As some guys asked me why I use arrows and not those fancy Halos or Wedges (actually I wonder if someone ever fully implemented Wedge for an interactive application) I thought it might be nice to be able to cite my own paper. Thus, I decided to compare some off-screen visualizations techniques for digital maps (e.g. Google maps) on mobile phones. As it would’ve been a bit boring to just repeat the same study conducted by Burigat and co I decided to let users interact with the map (instead of using a static prototype). To make it a bit more interesting (and because I’m lazy) we developed a prototype and published it to the Android Market. We collected some data from users that installed the app and completed an interactive tutorial. The results indicate that arrows are just better than Halos. However, our methodology is flawed and I assume that we haven’t measured what we intended to measure. You can test the application on you Android Phone or just have a look at the poster.

I’m a bit afraid that the papers will end up in the same session. Might be annoying for the audience to see two presentations with the same motivation and similar related work.