Tag Archives: participants

Analysis of User Studies at MobileHCI 2011

Flying back from another conference I had a look at the MobileHCI 2011 proceedings. Having seen a lot of fantastic talks I don’t remember a single presentation where I thought that the paper shouldn’t have been accepted (in contrast to some talks at this year’s Interact, previous MobileHCI, and similar conferences). Anyway, just as for the MobileHCI 2010 proceedings I went through all short and long papers to derive some statistics.

18 short papers and 45 long papers (20 more papers than last year) have been accepted with a slightly increased acceptance rate of 22.8%. As I focussed on the subjects that participate in the conducted studies I excluded 6 papers from the analysis because they are systems papers (or similar) and do not contain a real study.

Number of Subjects

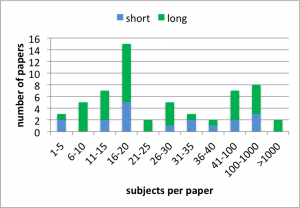
The average number of subjects per paper is M=1,969, SD=13,757. Removing the two outliers by Böhmer et al. (4,125 subjects) and our paper (103,932 subjects) the number of subjects is M=76.62, SD=159.84. The chart below shows the distribution of subjects per paper for the considered long and short papers.

Subjects’ gender

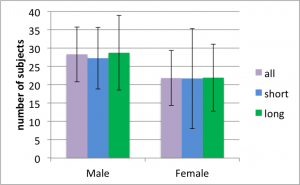
Not all papers report the subjects’ gender. If there are multiple studies in a paper and the gender is reported for one of the studies I still use the numbers. For the paper that report participants’ gender 28.28 (SD=49.07) are male and 21.84 (SD=49.26) are female. The chart below shows the number of males and females for short and long papers (error bars show the standard error).

A paired two-tailed t-test shows that there are significantly more male participants than female participants (p<.05, d=.13). The effect is also significant if only the long papers are considered (p<.01, d=.13) but not for the short papers (p=.54). The reason why the effect is not significant for short papers is The Hybrid Shopping List. Excluding this paper the effect is also significant for short papers (p<.01, d=0.68).

Subjects’ age

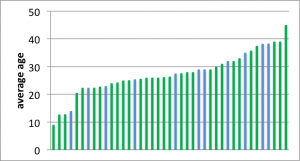
Not all papers report participants’ age in a consistent and complete way. Nonetheless, I tried my best to derive the age for all papers. The chart below shows the histogram for the 41 papers where I was able to derive the average age. The average for the considered papers is 27.46 years.

It is a bit difficult for me to understand why papers fail to report participants’ age and why the age is reported in so many different ways. Of course, the age might not always be seen as relevant and sometimes you just don’t know it. However, if the data is available it is so easy to provide a basic overview. Just report the age of the youngest and oldest participant along with the average age and the sample’s standard deviation. That even fits in a single line!

Subjects’ background

Getting a complete picture of the participants’ background is just impossible based on the papers alone. To many papers either report nothing about the participants’ background or only very specific aspects (e.g. ‘all participants are right handed’). Even using the sparse information it is clear to me that the fraction of students and colleagues that participate – both with a technical background – is much higher than their fraction of the population.

From my own experience I know that getting a nice sample for your study can cost a lot of resources and/or creativity. Thus, we often rely on ‘students and guys from the lab’ for our studies. IMHO it is often perfectly fine to use such a sample (e.g. when conducting a repeated-measures Fitts’ law experiment). Still I wonder if we optimize our research for this very particular target group and if this might be an issue for the field.

Discussion

I analysed the MobileHCI 2011 long and short papers to determine information about the subjects that participated in the respective studies. The number of subjects per paper is more than three times higher than 2010 even if we ignore the two outliers. One reason is that there are a few papers that contribute results from online questionnaires (or similar) that attracted some hundred participants. Even if we would also exclude these papers the sample size increased. Looking at participants’ gender we found a clear bias towards male participants. Compared to 2010, however, this bias got smaller. For 2010 we found 40.89% female participants while we found 43.57% for 2011. The age distribution shows that studies with elderlies are rare.

The data seems to support my impression that the quality is higher compared to last year. The sample size and the quality of the sample have both improved. Based on my subjective impression I also assume that the way demographics are reported improved compared to last year. Thus, I conclude that MobileHCI 2011 wasn’t only fantastic to attend but also provided a program with an outstanding quality.
Analysis of Studies at MobileHCI 2010

Yesterday I started to prepare my MobileHCI tutorial. It is basically about doing studies with a large number of subjects (e.g. >1,000) and therefore I started to wonder how many subjects participate in the average mobile HCI study. But first of all, what is MobileHCI anyway?

“MobileHCI provides a forum for academics and practitioners to discuss the challenges, potential solutions and innovations towards effective interaction with mobile systems and services. The conferences cover the analysis, design, evaluation and application of human-computer interaction techniques and approaches for all mobile computing devices, software and services.” [1]

Collected Data

Using the DBLP I fetched all short and long papers that have been presented at MobileHCI 2010. 20 short papers and 23 long papers have been accepted and the acceptance rate was about 20% [2].

For each paper I determined the total number of subjects that took part in the conducted studies. In fact, there is only one paper that comes without a study that involves human subjects. In addition, I tried to determine the number of male and female subjects as well as their age. Unfortunately, not all papers report participants’ age and gender. In [3] for example they conducted a study with 40 participants but I couldn’t find any information about their age or gender. Other papers only report participants’ age but not their gender (e.g. [4]). The way subjects’ age is reported is very inconsistent across the papers. [5,6], for example, give a range (e.g. “18 to 65 years”) while other papers provide more information (e.g. [7] reports that “Twenty university students (10 female and 10 male) aged between 23 and 34 (M=27.35, SD=3.10) participated in the study.”). I tried to guess or compute unclear details if I felt the paper provide enough information for doing that.

Number of subjects

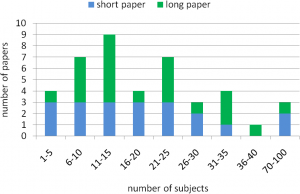
Overall, the average number of subjects per paper is M=21.49 (SD=19.99). For short papers the average number of subjects is M=23.20 (SD=24.95) and for long papers it is M=20.00 (SD=14.83). The chart below shows the histogram of the distribution.


Subjects’ gender

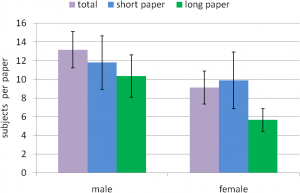
As described above it wasn’t always easy (or possible) to determine the subjects’ gender. Based on the provided data 474 males, 328 females, and 106 people with an unknown gender participated in the studies. That makes M=13.17 males (SD=11.59) and M=9.11 females (SD=10.63) per paper that reports the gender. The chart below shows the subjects’ gender for short and long papers. The error bars show one standard error.

Out of curiosity, I tested if the amount of guys and girls is significantly different. A simple paired t-test (probably not the best tool for such a post-hoc test) shows that significantly more males than females participated in the studies (p<.001, d=0.37). The difference is also significant for long papers (p<.01, d=0.57) but not for short papers (p=0.13, d=0.14).

So what?

From the analysis I learned that a number of papers only briefly describe their participants and not all report participants’ age and gender. Large-scale studies are obviously not common in the community. Half the papers conducted studies with 20 or less participants and there are only three papers with more than 40 participants. With 30% more males than females the sample is clearly biased towards male participants. I, however, must admit that a large and perfect sample of the population is not always necessary. [8] is a nice example of an ethnographic study and I guess no one would complain about the small biased sample. I might talk about the different kinds of studies that are conducted next time.

References

[1] The International Conference Series on Human Computer Interaction with Mobile Devices and Services website
[2] MobileHCI 2010 notification of acceptance email.
[3] Jarmo Kauko and Jonna Häkkilä: Shared-screen social gaming with portable devices. Proc. MobileHCI, 2010.
[4] Ming Ki Chong, Gary Marsden, and Hans Gellersen: GesturePIN: using discrete gestures for associating mobile devices. Proc. MobileHCI, 2010.
[5] Simon Robinson, Matt Jones, Parisa Eslambolchilar, Roderick Murray-Smith, and Mads Lindborg: “I did it my way”: moving away from the tyranny of turn-by-turn pedestrian navigation. Proc. MobileHCI, 2010.
[6] Yolanda Vazquez-Alvarez, and Stephen A. Brewster: Designing spatial audio interfaces to support multiple audio streams. Proc. MobileHCI, 2010.
[7] Alessandro Mulloni, Andreas Dünser, and Dieter Schmalstieg: Zooming interfaces for augmented reality browsers. Proc. MobileHCI, 2010.
[8] Marianne Graves Petersen, Aviaja Borup Lynggaard, Peter Gall Krogh, and Ida Wentzel Winther: Tactics for homing in mobile life: a fieldwalk study of extremely mobile people. Proc. MobileHCI, 2010.