Flying back from another conference I had a look at the MobileHCI 2011 proceedings. Having seen a lot of fantastic talks I don’t remember a single presentation where I thought that the paper shouldn’t have been accepted (in contrast to some talks at this year’s Interact, previous MobileHCI, and similar conferences). Anyway, just as for the MobileHCI 2010 proceedings I went through all short and long papers to derive some statistics.
18 short papers and 45 long papers (20 more papers than last year) have been accepted with a slightly increased acceptance rate of 22.8%. As I focussed on the subjects that participate in the conducted studies I excluded 6 papers from the analysis because they are systems papers (or similar) and do not contain a real study.
Number of Subjects
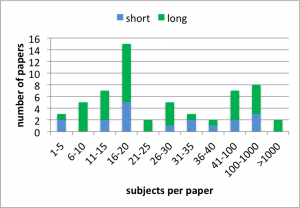
The average number of subjects per paper is M=1,969, SD=13,757. Removing the two outliers by Böhmer et al. (4,125 subjects) and our paper (103,932 subjects) the number of subjects is M=76.62, SD=159.84. The chart below shows the distribution of subjects per paper for the considered long and short papers.
Subjects’ gender
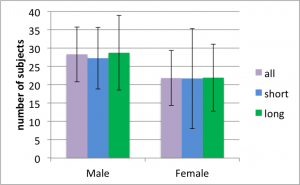
Not all papers report the subjects’ gender. If there are multiple studies in a paper and the gender is reported for one of the studies I still use the numbers. For the paper that report participants’ gender 28.28 (SD=49.07) are male and 21.84 (SD=49.26) are female. The chart below shows the number of males and females for short and long papers (error bars show the standard error).
A paired two-tailed t-test shows that there are significantly more male participants than female participants (p<.05, d=.13). The effect is also significant if only the long papers are considered (p<.01, d=.13) but not for the short papers (p=.54). The reason why the effect is not significant for short papers is The Hybrid Shopping List. Excluding this paper the effect is also significant for short papers (p<.01, d=0.68).
Subjects’ age
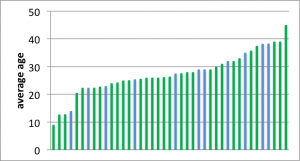
Not all papers report participants’ age in a consistent and complete way. Nonetheless, I tried my best to derive the age for all papers. The chart below shows the histogram for the 41 papers where I was able to derive the average age. The average for the considered papers is 27.46 years.
It is a bit difficult for me to understand why papers fail to report participants’ age and why the age is reported in so many different ways. Of course, the age might not always be seen as relevant and sometimes you just don’t know it. However, if the data is available it is so easy to provide a basic overview. Just report the age of the youngest and oldest participant along with the average age and the sample’s standard deviation. That even fits in a single line!
Subjects’ background
Getting a complete picture of the participants’ background is just impossible based on the papers alone. To many papers either report nothing about the participants’ background or only very specific aspects (e.g. ‘all participants are right handed’). Even using the sparse information it is clear to me that the fraction of students and colleagues that participate – both with a technical background – is much higher than their fraction of the population.
From my own experience I know that getting a nice sample for your study can cost a lot of resources and/or creativity. Thus, we often rely on ‘students and guys from the lab’ for our studies. IMHO it is often perfectly fine to use such a sample (e.g. when conducting a repeated-measures Fitts’ law experiment). Still I wonder if we optimize our research for this very particular target group and if this might be an issue for the field.
Discussion
I analysed the MobileHCI 2011 long and short papers to determine information about the subjects that participated in the respective studies. The number of subjects per paper is more than three times higher than 2010 even if we ignore the two outliers. One reason is that there are a few papers that contribute results from online questionnaires (or similar) that attracted some hundred participants. Even if we would also exclude these papers the sample size increased. Looking at participants’ gender we found a clear bias towards male participants. Compared to 2010, however, this bias got smaller. For 2010 we found 40.89% female participants while we found 43.57% for 2011. The age distribution shows that studies with elderlies are rare.
The data seems to support my impression that the quality is higher compared to last year. The sample size and the quality of the sample have both improved. Based on my subjective impression I also assume that the way demographics are reported improved compared to last year. Thus, I conclude that MobileHCI 2011 wasn’t only fantastic to attend but also provided a program with an outstanding quality.


